Visualization
Pypianoroll provides tools for visualizing piano rolls. Here are some examples.
Functions
- pypianoroll.plot(obj: Union[pypianoroll.track.Track, pypianoroll.multitrack.Multitrack], **kwargs) Union[List[matplotlib.axes._axes.Axes], matplotlib.axes._axes.Axes][source]
Plot the object.
See
pypianoroll.plot_multitrack()andpypianoroll.plot_track()for full documentation.
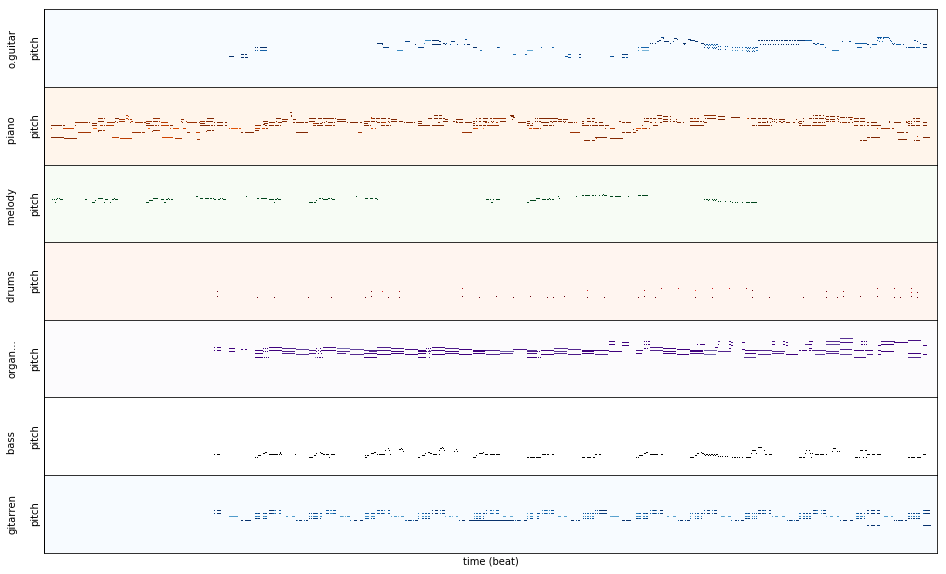
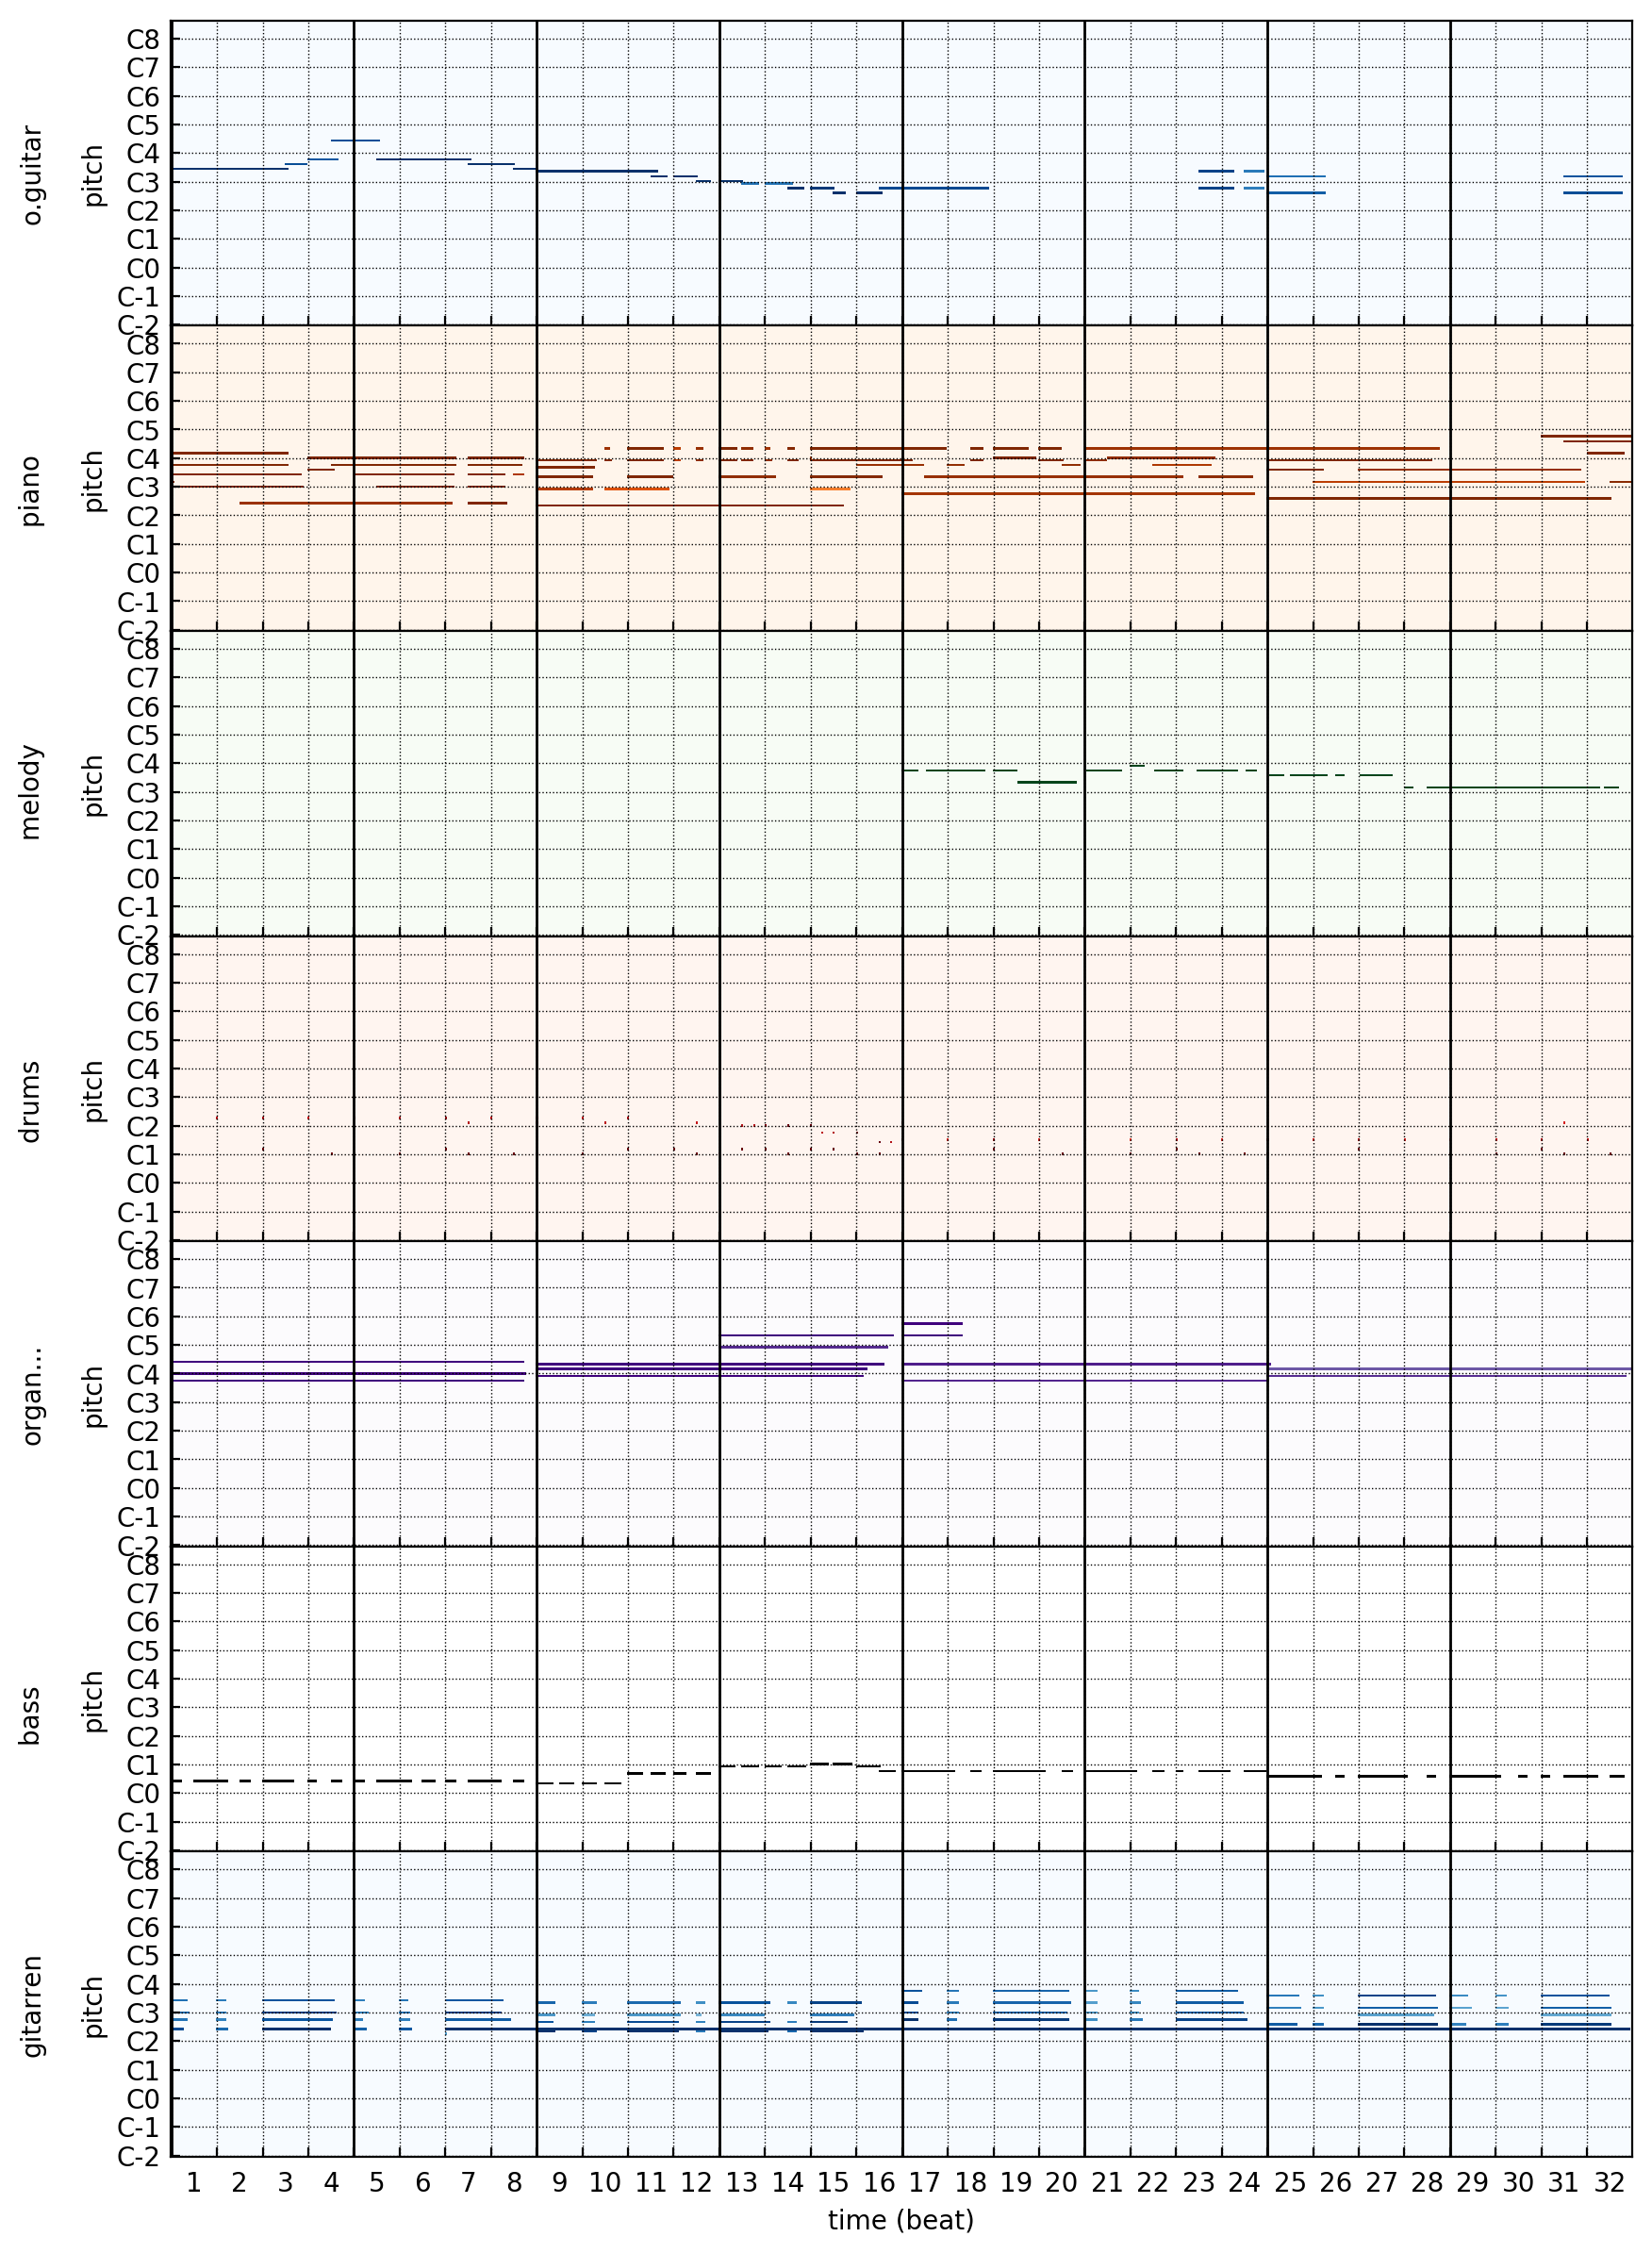
- pypianoroll.plot_multitrack(multitrack: Multitrack, axs: Sequence[matplotlib.axes._axes.Axes] = None, mode: str = 'separate', track_label: str = 'name', preset: str = 'full', cmaps: Sequence[str] = None, xtick: str = 'auto', ytick: str = 'octave', xticklabel: bool = True, yticklabel: str = 'auto', tick_loc: Sequence[str] = ('bottom', 'left'), tick_direction: str = 'in', label: str = 'both', grid_axis: str = 'both', grid_linestyle: str = ':', grid_linewidth: float = 0.5, **kwargs) List[matplotlib.axes._axes.Axes][source]
Plot the multitrack.
- Parameters
multitrack (
pypianoroll.Multitrack) – Multitrack to plot.axs (sequence of
matplotlib.axes.Axes, optional) – Axes to plot the tracks on.mode ({'separate', 'blended', 'hybrid'}, default: 'separate') – Plotting strategy for visualizing multiple tracks. For ‘separate’ mode, plot each track separately. For ‘blended’, blend and plot the pianoroll as a colored image. For ‘hybrid’ mode, drum tracks are blended into a ‘Drums’ track and all other tracks are blended into an ‘Others’ track.
track_label ({'name', 'program', 'family', 'off'}) – Track label format. When mode is ‘hybrid’, all options other than ‘off’ will label the two track with ‘Drums’ and ‘Others’.
preset ({'full', 'frame', 'plain'}, default: 'full') – Preset theme to use. For ‘full’ preset, ticks, grid and labels are on. For ‘frame’ preset, ticks and grid are both off. For ‘plain’ preset, the x- and y-axis are both off.
cmaps (tuple or list) – Colormaps. Will be passed to
matplotlib.pyplot.imshow(). Only effective when pianoroll is 2D. Defaults to ‘Blues’. If mode is ‘separate’, defaults to (‘Blues’, ‘Oranges’, ‘Greens’, ‘Reds’, ‘Purples’, ‘Greys’). If mode is ‘blended’, defaults to (‘hsv’). If mode is ‘hybrid’, defaults to (‘Blues’, ‘Greens’).**kwargs – Keyword arguments to pass to
pypianoroll.plot_pianoroll().
- Returns
(Created) list of Axes objects.
- Return type
list of
matplotlib.axes.Axes
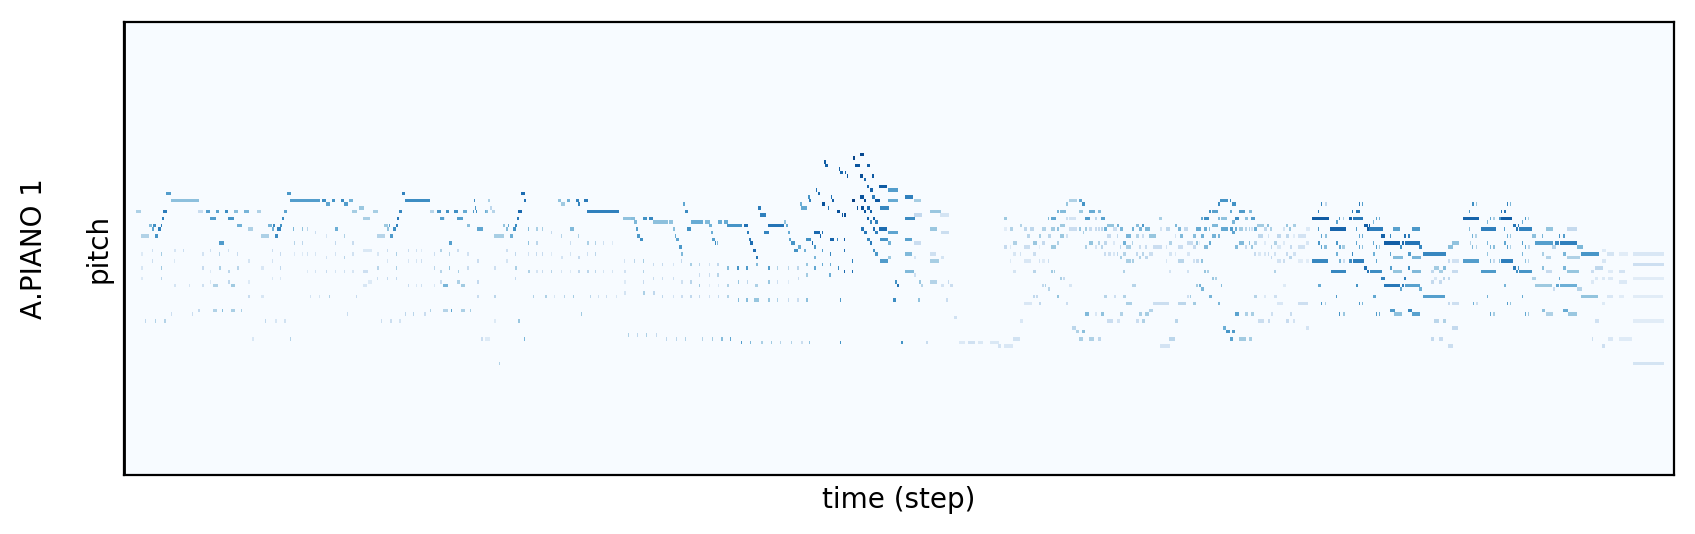
- pypianoroll.plot_track(track: Track, ax: matplotlib.axes._axes.Axes = None, **kwargs) matplotlib.axes._axes.Axes[source]
Plot a track.
- Parameters
track (
pypianoroll.Track) – Track to plot.ax (
matplotlib.axes.Axes, optional) – Axes to plot the piano roll on. Defaults to call plt.gca().**kwargs – Keyword arguments to pass to
pypianoroll.plot_pianoroll().
- Returns
(Created) Axes object.
- Return type
- pypianoroll.plot_pianoroll(ax: matplotlib.axes._axes.Axes, pianoroll: numpy.ndarray, is_drum: bool = False, resolution: Optional[int] = None, downbeats: Optional[numpy.ndarray] = None, preset: str = 'full', cmap: str = 'Blues', xtick: str = 'auto', ytick: str = 'octave', xticklabel: bool = True, yticklabel: str = 'auto', tick_loc: Sequence[str] = ('bottom', 'left'), tick_direction: str = 'in', label: str = 'both', grid_axis: str = 'both', grid_linestyle: str = ':', grid_linewidth: float = 0.5, **kwargs)[source]
Plot a piano roll.
- Parameters
ax (
matplotlib.axes.Axes) – Axes to plot the piano roll on.pianoroll (ndarray, shape=(?, 128), (?, 128, 3) or (?, 128, 4)) – Piano roll to plot. For a 3D piano-roll array, the last axis can be either RGB or RGBA.
is_drum (bool, default: False) – Whether it is a percussion track.
resolution (int) – Time steps per quarter note. Required if xtick is ‘beat’.
downbeats (list) – Boolean array that indicates whether the time step contains a downbeat (i.e., the first time step of a bar).
preset ({'full', 'frame', 'plain'}, default: 'full') – Preset theme. For ‘full’ preset, ticks, grid and labels are on. For ‘frame’ preset, ticks and grid are both off. For ‘plain’ preset, the x- and y-axis are both off.
cmap (str or
matplotlib.colors.Colormap, default: ‘Blues’) – Colormap. Will be passed tomatplotlib.pyplot.imshow(). Only effective when pianoroll is 2D.xtick ({'auto', 'beat', 'step', 'off'}) – Tick format for the x-axis. For ‘auto’ mode, set to ‘beat’ if resolution is given, otherwise set to ‘step’. Defaults to ‘auto’.
ytick ({'octave', 'pitch', 'off'}, default: 'octave') – Tick format for the y-axis.
xticklabel (bool) – Whether to add tick labels along the x-axis.
yticklabel ({'auto', 'name', 'number', 'off'}, default: 'auto') – Tick label format for the y-axis. For ‘name’ mode, use pitch name as tick labels. For ‘number’ mode, use pitch number. For ‘auto’ mode, set to ‘name’ if ytick is ‘octave’ and ‘number’ if ytick is ‘pitch’.
tick_loc (sequence of {'bottom', 'top', 'left', 'right'}) – Tick locations. Defaults to (‘bottom’, ‘left’).
tick_direction ({'in', 'out', 'inout'}, default: 'in') – Tick direction.
label ({'x', 'y', 'both', 'off'}, default: 'both') – Whether to add labels to x- and y-axes.
grid_axis ({'x', 'y', 'both', 'off'}, default: 'both') – Whether to add grids to the x- and y-axes.
grid_linestyle (str) – Grid line style. Will be passed to
matplotlib.axes.Axes.grid().grid_linewidth (float) – Grid line width. Will be passed to
matplotlib.axes.Axes.grid().**kwargs – Keyword arguments to be passed to
matplotlib.axes.Axes.imshow().